Google Analytics is an application for tracking traffic patterns on your website. In this ‘101’ introduction to Google Analytics, we will show you how to access analytics on your new website and briefly walk you through what you can do with this program, including analyzing the visitors to your site, traffic sources, content and conversions. Every new site built by Decoy comes with Analytics. Please note – analytics is by no means perfect, data can be impacted by a number of factors such as issues with the tracking code or referral spam, but more about this later.
When used correctly, Google Analytics can provide valuable insight into your website’s audience and traffic. By using Analytics you can identify the devices (smartphones, desktops, tablets) and channels (ads, websites, videos, social media, search engines, paid search) through which potential customers are coming to your website. Analytics can also show how long visitors are spending on your site, the content that they are viewing and the rate at which visitors are being converted into customers. Armed with this information you can gain a better understanding of your audience, their needs and the channels your business should be targeting to reach them most effectively. All told, Analytics can help determine where you can improve your website’s performance and get the best bang for buck from your marketing spend.
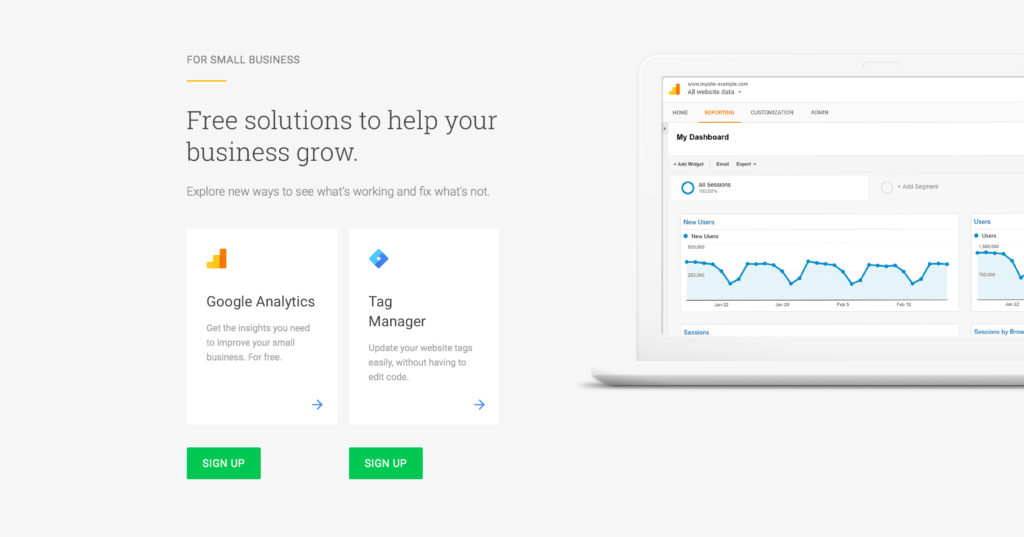
As a client of Decoy we would have set up your website analytics through our Decoy Marketing Google account and will provide you with regular analytics insights. If you’d like to access your data directly, you will firstly need to create a Google account. If you have a Gmail account, use these details and head to https://analytics.google.com/analytics/web and login. If you don’t yet have a Google account, create one, a good idea is to use ‘yourcompanyname@gmail.com’ e.g. ‘decoymarketing@gmail.com’. Once this is created, we will login to
your account and add your Google username to give you account privileges. If you don’t have analytics on your site then get in touch with us and we will set this up for you.
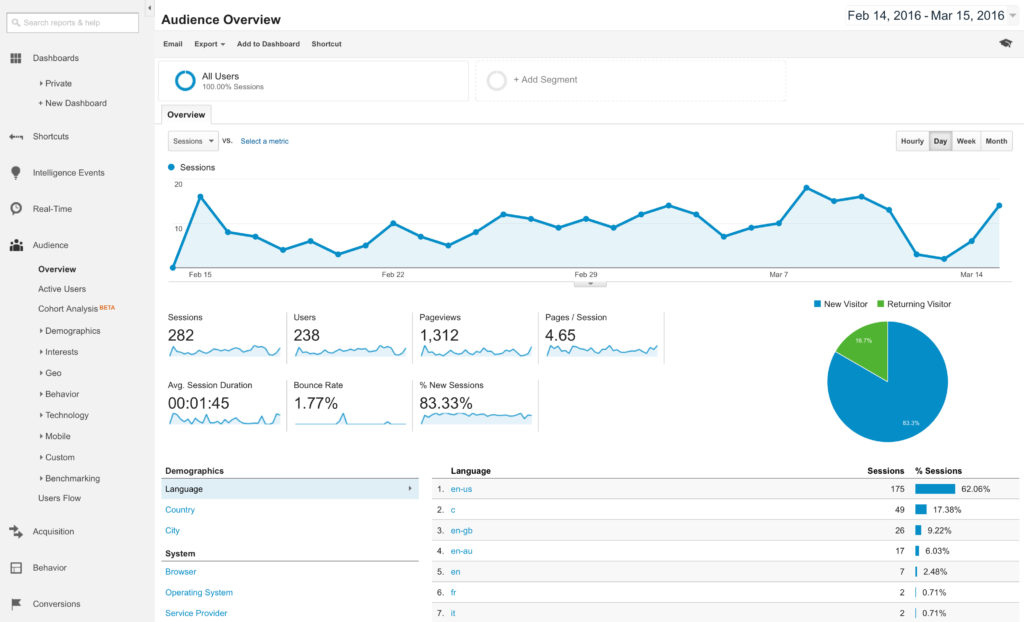
When you first login, you’ll be brought to the Visitors Overview screen. At the top of the report, you’ll see a chart showing your traffic patterns for the past month. You can use the dropdown to change the date this graph and the rest of your reports show (or you can choose to compare two date ranges).
On the chart you can choose to create annotations for specific days. Say, for example, you had a media release on a particular day. You could add an annotation to that day, so that when you look back on your traffic patterns at a later date you’ll know exactly what caused a spike in traffic. You can do the same if you have a sudden drop in traffic, say if your website went down for a few hours.
The visitors overview is the default screen you saw above, in this example the graph is showing the number of session per day, with key stats around the number of users, page views, bounce rate and average session duration. It also shows you the percentage of new visits (a pie chart comparing new to returning visitors is also shown). This screen gives you a good, high-level overview of how your site is doing. High pages/visit, high average time on your site, and a low bounce rate are the goals here.
You’ll also see that there are some basic demographics, system and mobile reports at the bottom of the overview screen. For most Canberra based businesses the language, country and operating system are not important. The mobile reports can give you a good understanding of how your customers access your site (pc or mobile) and highlight any issues around site content.
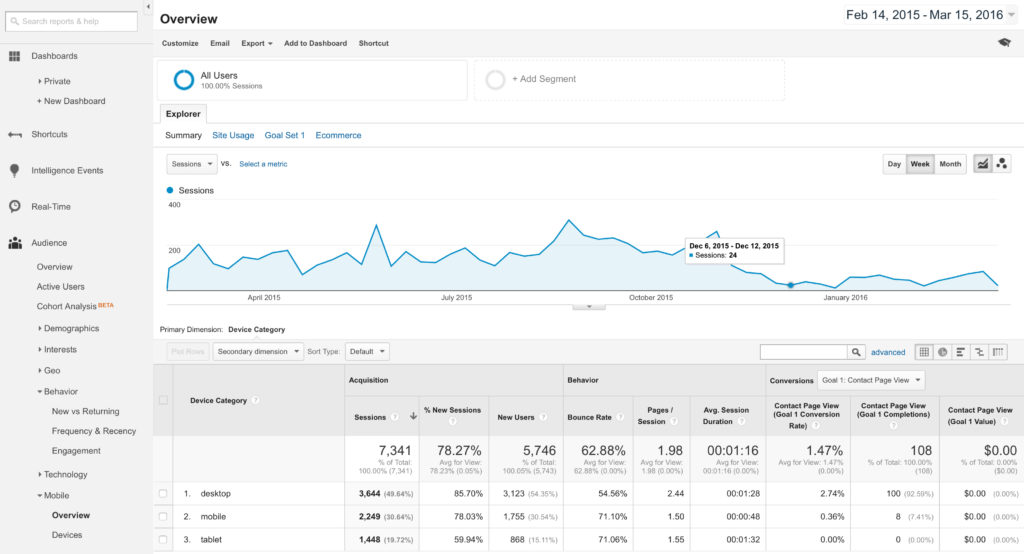
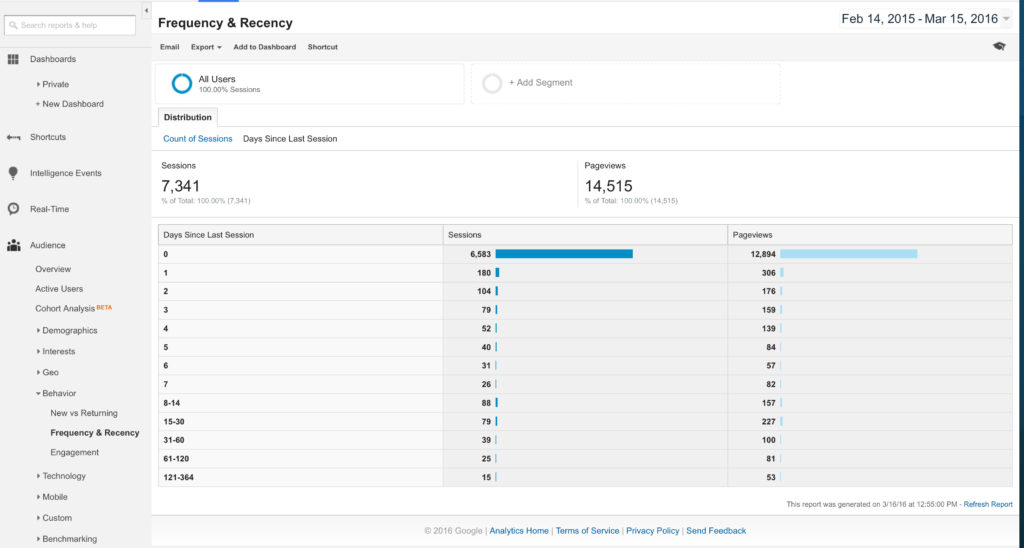
The next sub-report in the visitors section is behavior. This section gives you more information about new vs returning visitors, how frequently and recently visitors are returning to your site, and user engagement. Looking at how many visitors you have returning frequently gives you an idea of how many true fans you have. Users who have visited your site a dozen or more times are most likely loyal followers of your site or company. You can also view the “days since last visit” report, which gives you an idea of how often your return visitors are coming back to your site.
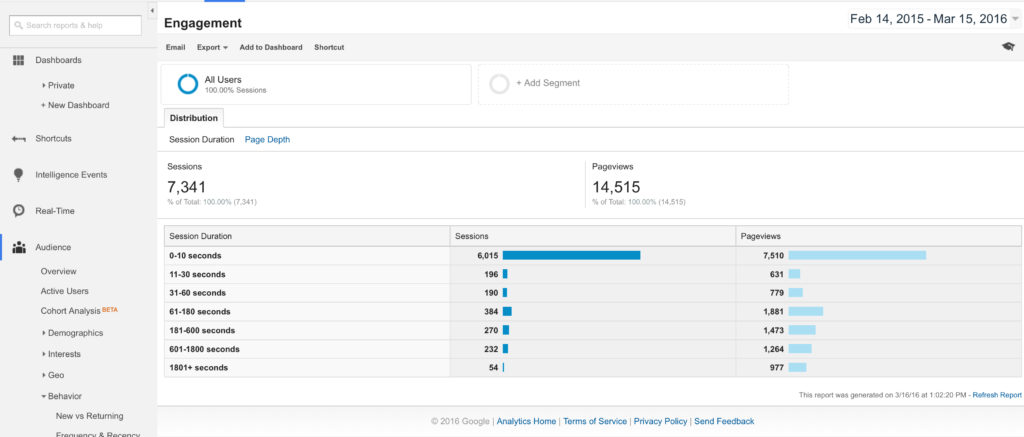
The engagement report shows you two key metrics: the visit duration and the page depth (how many pages a visitor viewed). Visitors who stay on your site longer and view more pages are more engaged. You want a high number of visitors viewing more than one page, and staying on your site more than a few seconds.
In the visitors section we looked at understanding how many visitors came to your site and how they behaved once they got there. Wouldn’t it be great to know how your visitors arrived at your website? Then you could do more of what works and less of what doesn’t – the good news is this is all possible.
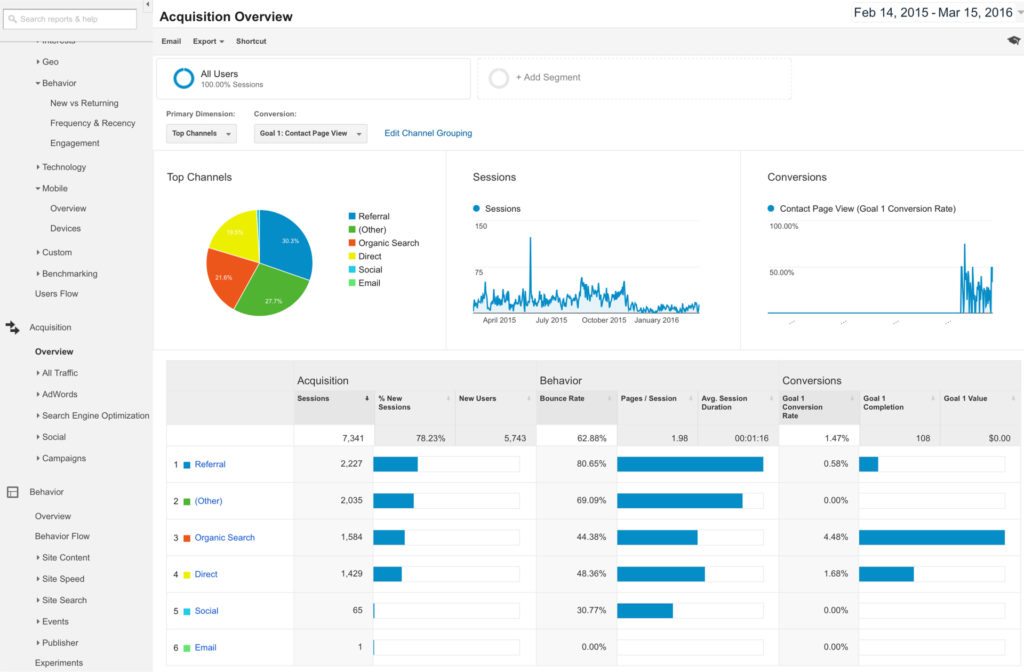
The traffic sources overview tells you where your traffic is coming from, giving us all the information we need to determine the success of paid campaigns, e.g. Google Adwords and social media as well as indicating the strength or digital position of your website. We can get a gauge from other sites in your industry and determine how your business is positioned relative to them in terms of their organic and referral traffic.
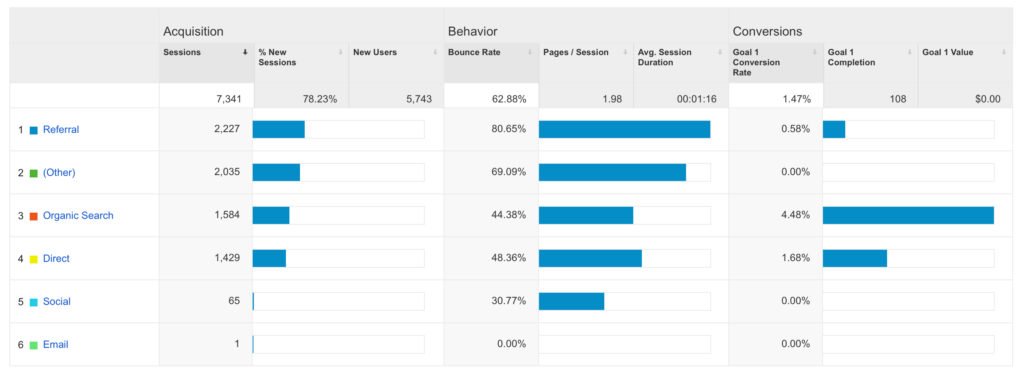
The goal with traffic sources is to have a varied traffic pie, similar to an investment strategy, we don’t want too much of your traffic coming from one source, in case it gets cut off. We also want to look at more than just the amount of traffic being generated by each activity and look into the quality of traffic that gets driven to your website by different approaches. In the example below, we can see that ‘referral’ is driving plenty of traffic to the site, however users who arrive to the site via ‘organic search’ are much more likely to submit a
contact request form (.58% vs 4.48%) and also much less likely to bounce out of the site (80.65% vs 44.38%). So you could say that organic search users view this website as more relevant, engaging and are more likely to contact the business than referral users.
So we’ve talked about understanding our users and how they arrive, but inevitably at some point our users are going to leave the site. From the exit data we can get some key insights about how they do this and thus make improvements to the site so that users stay longer or take the actions that we want them to.
What we look for here are trends, specifically around exit pages. A high number of exits from a particular page may be telling us one of a number of things. It may indicate that the page was not relevant to our users, that it didn’t load quickly enough or at all, that the page had everything the user needed or perhaps that they made a phone call without submitting a contact request.
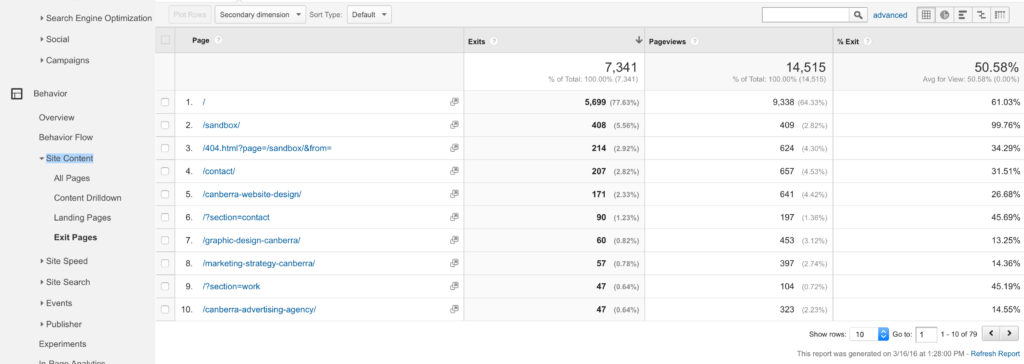
Examining the data above reveals that this site looks pretty good when it comes to exits. The majority of user exits are on the homepage, which is the most common page so likely to happen. The next most user exits occur on the aluminium products page. Again this is understandable as users would navigate to that page from the homepage. The third most user exits happen on the the contact page. This is great as users exiting from the contact page are likely to have submitted a contact request or called one of the stores.
So make sure that you take a look at your exits data and if it doesn’t make sense, review the page and check for errors stopping your sales funnel. This will help ensure a better performing website.
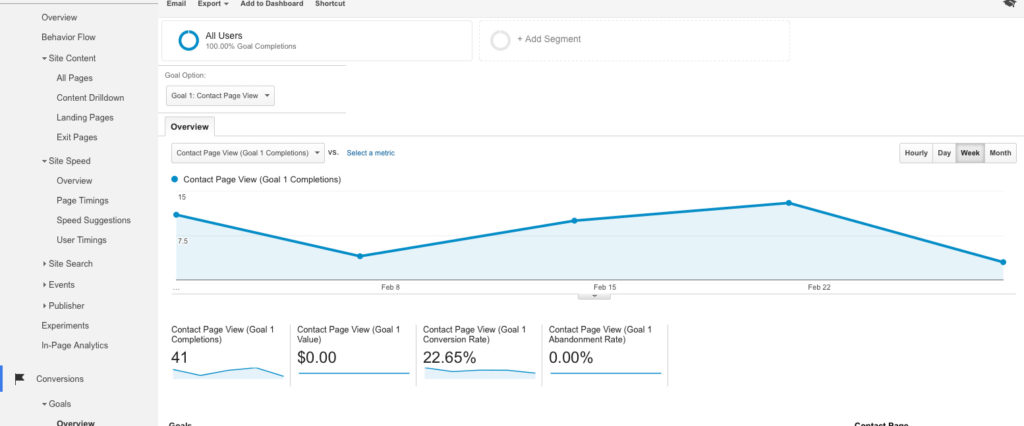
It’s important to set goals in most areas of life, Analytics goals are no different. We use goals for tracking different kinds of actions on your site (like length of time spent, reaching a specific page, or visiting a certain number of pages). There are four different kinds of goals. Some are simply pages on your site you want visitors to reach. This could be a thankyou page after someone has submitted a contact request (so you can understand how many and what percentage of users visiting the site take this action), a particular product page (to allow understanding of how relevant your users find that particular product or service), or it could be something like your contact page or a request for information. You can also set a goal for a length of time spent on your site, the number of pages/visits, or an event.
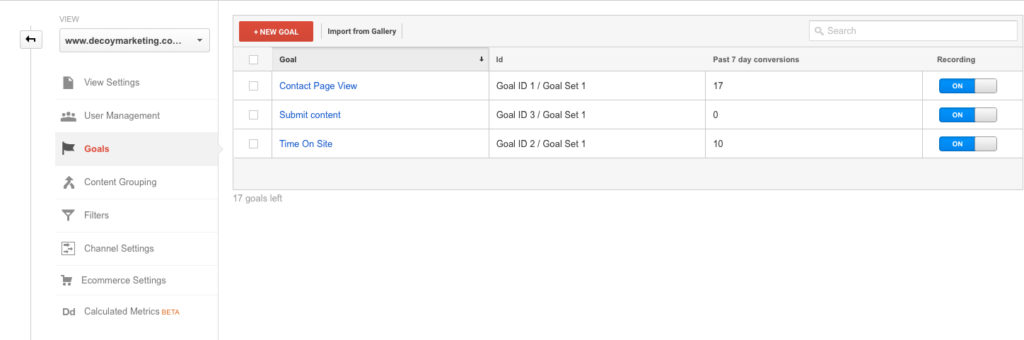
To set up a goal, simply select which goal group you want to use, name your goal, and then define the goal type. You’ll have different options from there depending on which type of goal you’re setting up. It’s a good idea to at least set up goals for the last page in your conversion process. You can also set up a funnel, or a series of pages leading up to your goal page. If you set this up, you can more easily monitor at what point users abandon the conversion process.